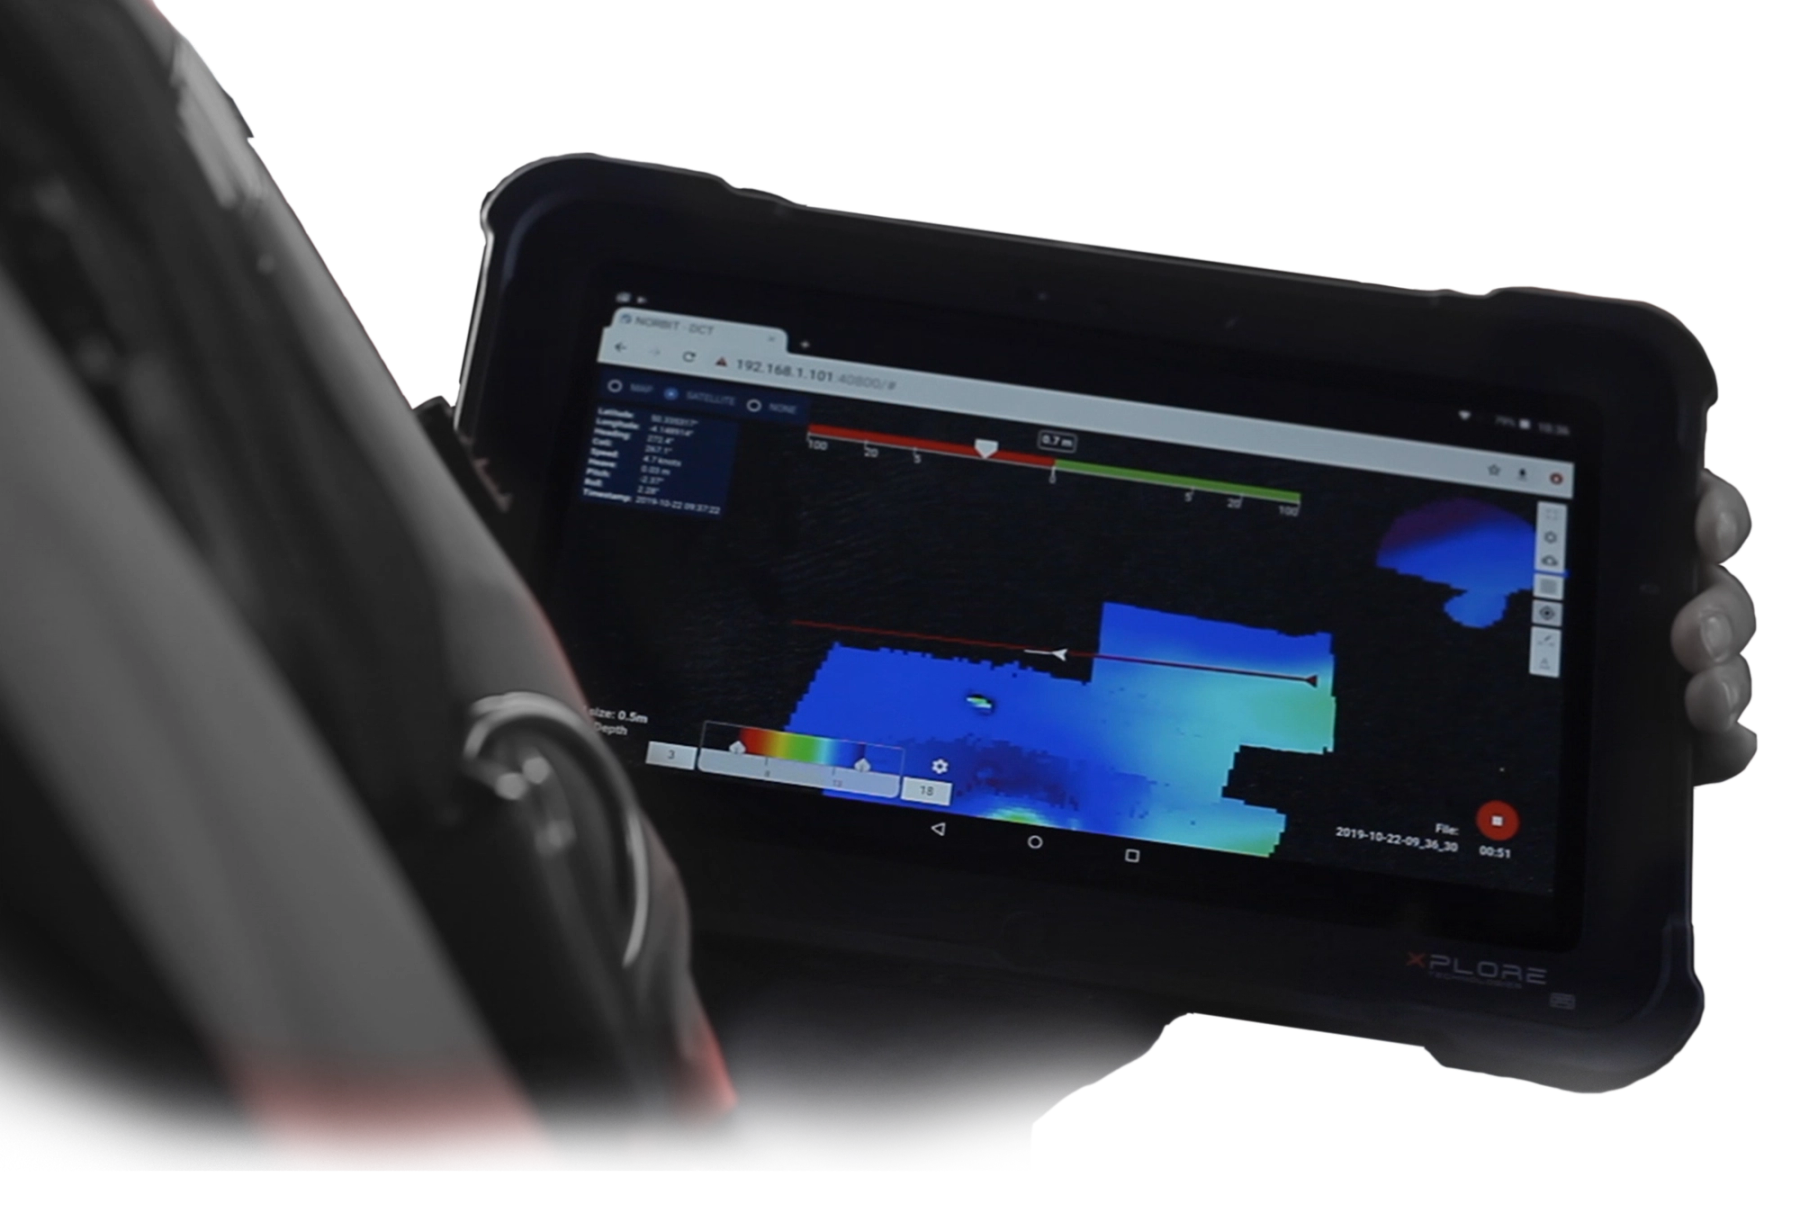
DCT is a survey utility tool designed to simplify standard bathymetry survey operations. The bathymetry grid is displayed in a web browser, giving real-time indication of coverage and data quality while running the survey.
DCT is particularly suitable for small boats and single-person operations, as well as USVs with low-bandwidth radio connectivity to the operator. It runs on a navigation plotter touch screen, tablet, smartphone, or PC, and offers browser-accessible tools for efficient survey mission planning. With a tap or mouse click, users can draw lines and generate wing lines with a given spacing in seconds. Each line can be adjusted, moved, rotated, resized, or deleted as needed.
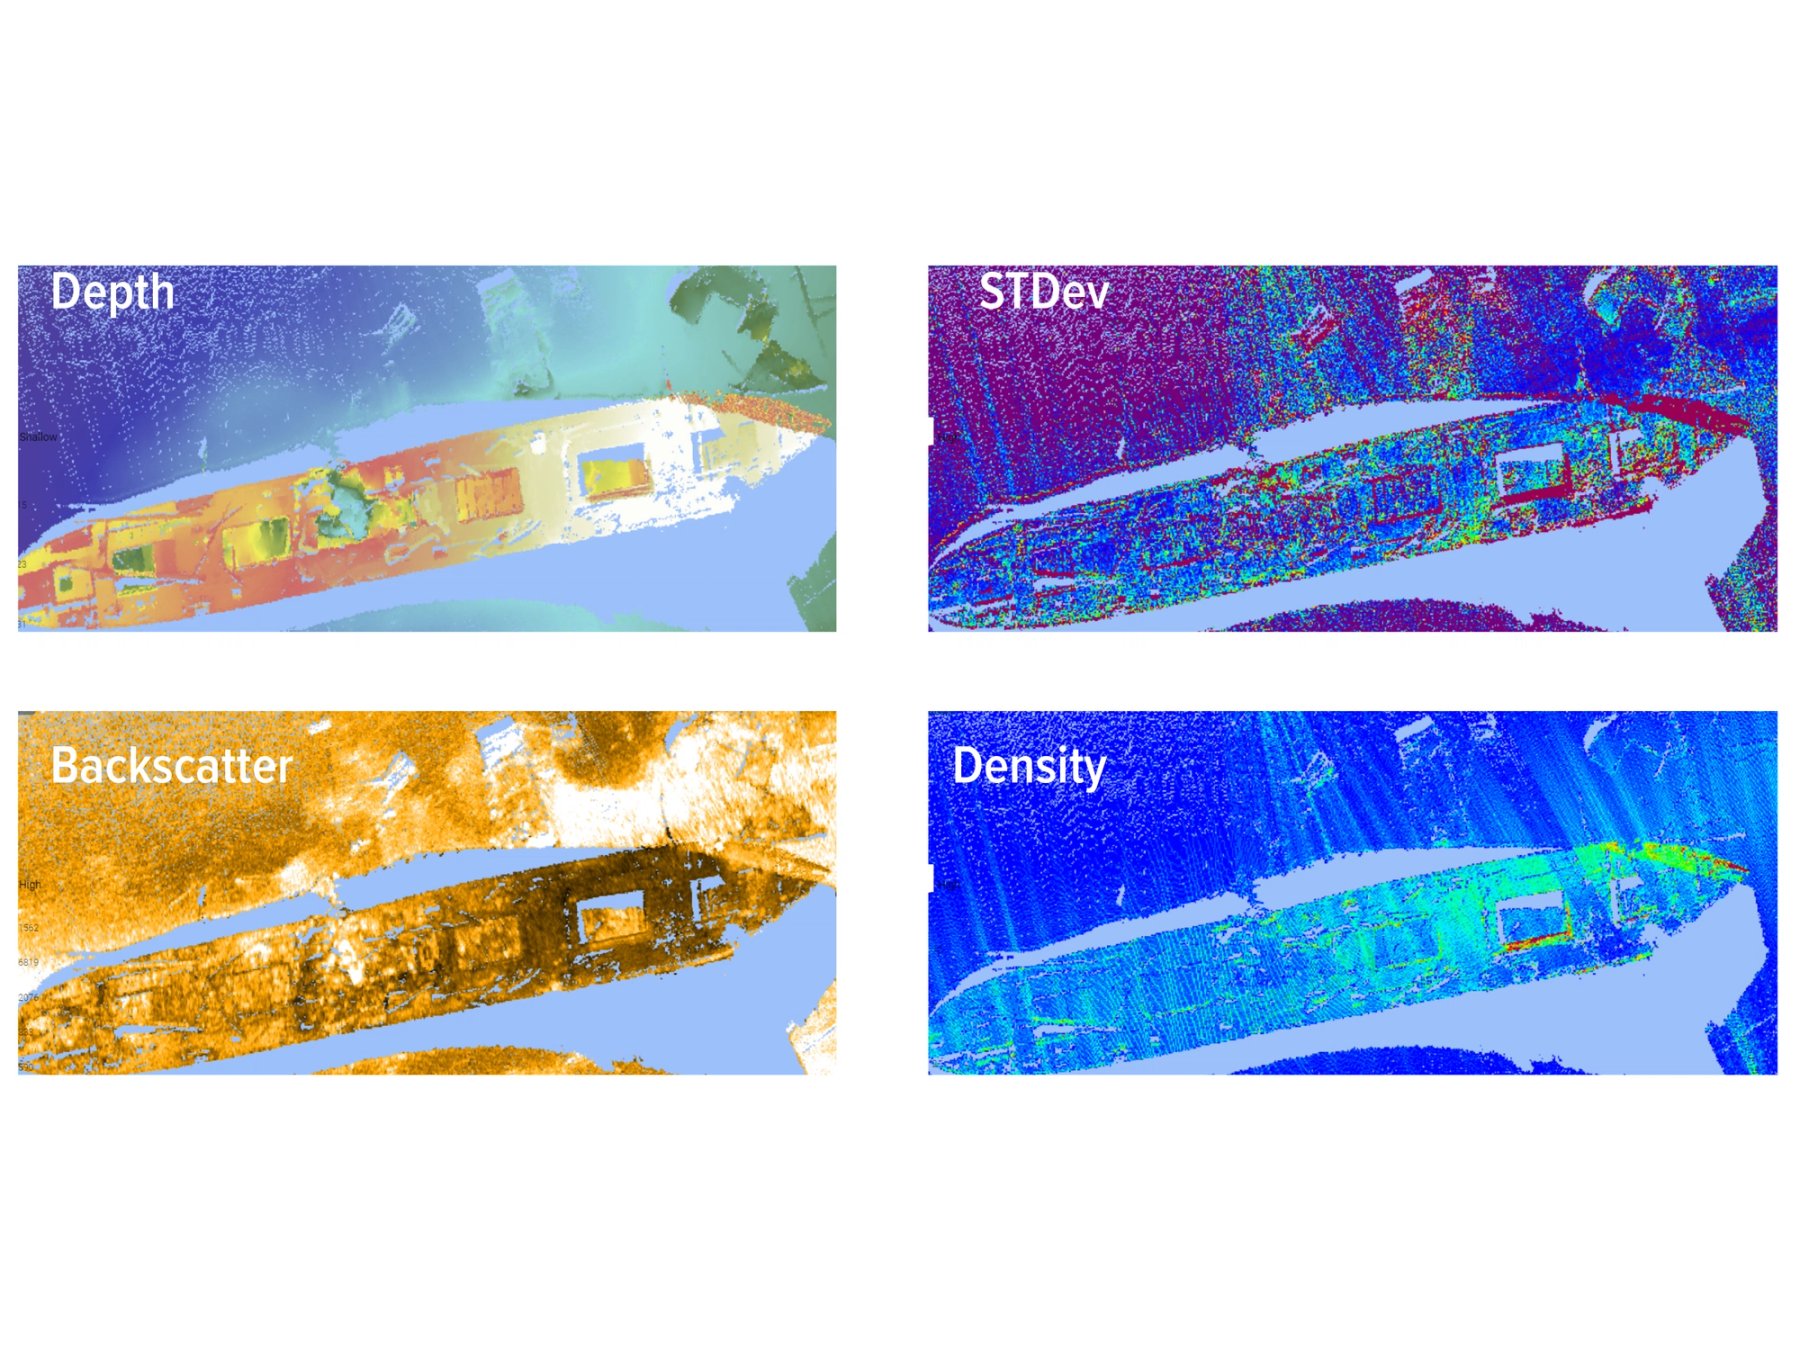
Real-time displays include depth, sounding density, backscatter, and standard deviation. All four displays run concurrently across one or several clients — the skipper can view the depth display while the surveyor or a remote QA assistant monitors standard deviation and sounding density.
Background Google Maps imagery can be configured per client according to user preferences. DCT offers a simple, reliable data collection method with predictable and known data outputs. All data is collected in NORBIT *.wbm format as well as the popular *.s7k file format. Collecting data with respect to the ellipsoid allows larger organisations to send less experienced personnel into the field without risk of incorrect geodetic settings.
DCT comes with data sharing capabilities based on PostGIS and GeoServer frameworks, and supports standard WMS and WFS protocols. This offers seamless integration with GIS software such as QGIS for immediate data access and further processing in any workflow.
DCT is sold with NORBIT's integrated ultra-high-resolution sonars.
Key features
- Runs in a web browser
- Easy to use right-click menus
- Easy to learn and use
- Allows junior surveyors to collect quality data
- Can be used simultaneously with other acquisition software